The first question a seller asks us as a website broker when looking to sell their online business: “What is it worth?”
By Jock Purtle and Robert Kale
Back in 2008, we started analyzing all online business transactions that we could find for the previous year and presented it in a report to help online business owners, like you, sell your website. Each year, we analyze the previous year’s sales to come up with industry averages. Fast forward to today — this article represents a sales data analysis of the past 13 years from 2008-2021.

You will see the term “multiple” a lot in this article. That is referring to a multiple of the business’s profit. We use that multiple to determine the valuation, or list price, for the business. We calculate the profit for the business using SDE (Seller’s Discretionary Earnings) using this formula:
SDE = Net Profit + Owner Wages/Benefits,
In other words:
SDE = Total Sales – Cost of Goods Sold – Expenses + Owners Wages/Benefits
What are the Market Trends?
What is also discussed and needs explaining is when we say, for example, a “multiple of 2.44x.” This means that the amount paid for the business is a value of 2.44 times the profit (SDE).
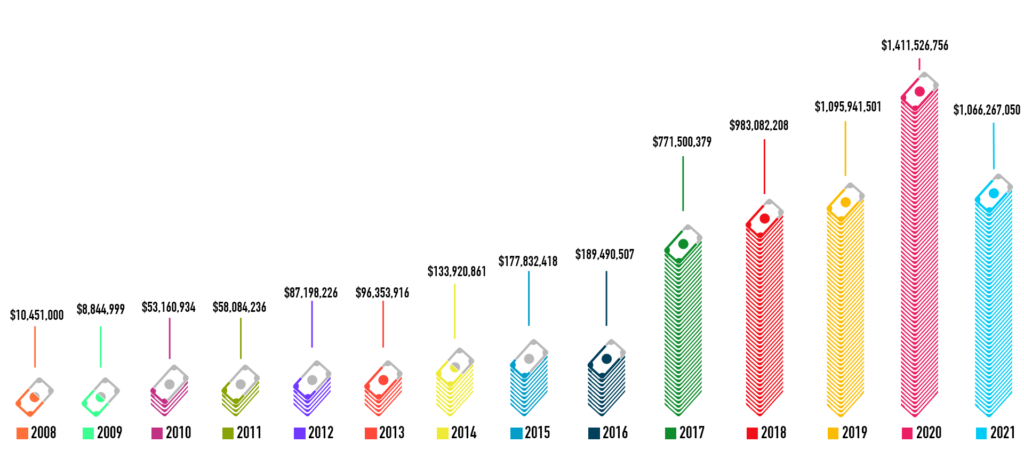
Total Deal Volume (Selling Price) by Year:
EXAMPLE:
A business that is doing $300,000 in profit per year that sold for 2.44x means the selling price was: $300,000 * 2.44 = $732,000. This works in reverse as well. If a business sold for $723,000 at 2.44x, then (2.44 = $732,000 / 2.4x means the profit was $300,000). Note that the SDE is typically calculated for the trailing twelve months (TTM) of the business.
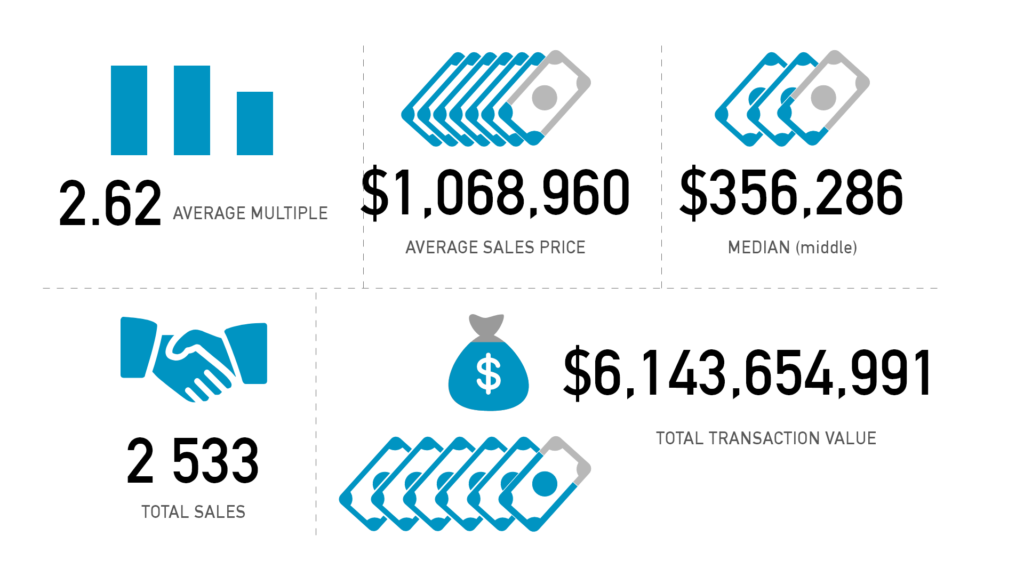
We Analyzed 2,543 Businesses With 7 Different Business Models
For this report, we analyzed 2,543 businesses that were listed from 2008 to 2021.
What we’re seeing from the data is a steady increase year-over-year in the average multiple of an internet business sale — and this trend continued through 2021.
In 2017, we saw an explosion in Ecommerce sales and this did not slow down in the following years.
This graph breaks down the percentage of the total deals each business category represented:

Below is how we categorized each business model:
-
- Advertising – a website monetized through ads or affiliate offers
- Ecommerce – traditional Ecommerce stores, drop-shipping and digital products
- Ecommerce FBA – a storefront on Amazon, including businesses that hold inventory through Amazon FBA or ship inventory themselves or through other means.
- Lead Generation – websites monetized through selling leads
- Service – websites monetized through providing a service
- Software – SAAS (software as a service) and any other software application-based business
Where Can You Sell Your Online Business?
Small Websites (Under $100K) – Sell yourself
Smaller business and micro-businesses are usually best sold privately by the owner through forums or classified websites. To sell your small business, check out Flippa.
Medium Websites (Under $50M) – Sell with a broker
Medium-sized businesses making between $250K and $20M in profit are best sold through brokers who help with finding buyers and negotiating and structuring the deal. We recommend Digital Exits.
Large Websites (Over $50M) – Sell with an investment bank or merger & acquisition company
Larger businesses making over $20M in yearly profit are best sold through investment banks or merger and acquisition companies. To sell your large business, check out Business Exits.
What We Found From Our Analysis
This graph represents a snapshot of the total data. It will give you a better understanding of where your business sits in comparison to all the businesses analyzed. The sum of transactions between 2008 and 2021 is over $4 billion. We believe this represents only 10-15% of the overall market of traded web businesses. The rest are either partner buyouts, employee buyouts or private transactions.
What Is The Average Multiple Per Business Model?
Now that we have over 14 years of data, we can see how the average multiple has changed annually: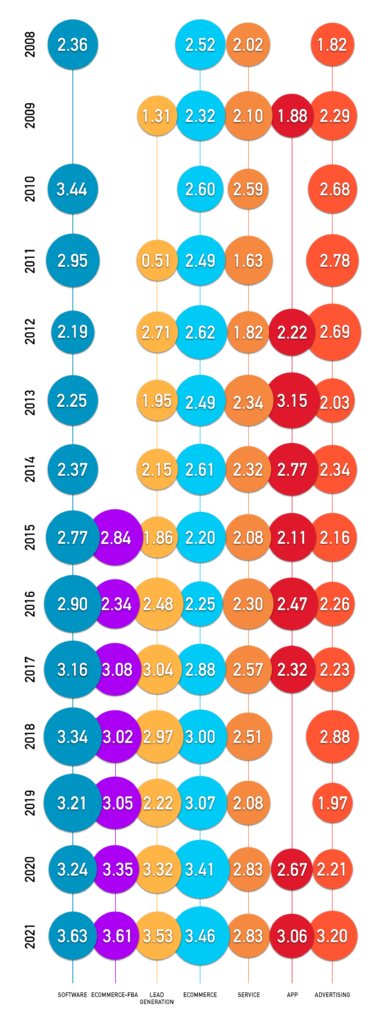
Here are my thoughts on why there is a differentiation in average multiple between each business model:
Advertising – Demands a low multiple because you don’t control the customer. Essentially, advertising websites drive people to their website with the goal to send them away to another source.
Ecommerce – A consistent performer with a large volume of businesses selling and growing fast. It is, in my opinion, the easiest business to understand and train a new buyer on. With the ease of platforms like Shopify, they also often require fewer hours per week to maintain, and the owner can focus on marketing and growth. Many more ecommerce listings are coming to market and fetching higher multiples every year.
Ecommerce FBA – The fastest growing segment. Amazon-based businesses, however, demand a lower multiple than standalone Ecommerce websites. This is mainly because the business owner does not “own” the customers – Amazon does. Also, there is always an inherent threat of Amazon competing with the business, adding more risk for the buyer.
Lead Generation – Lead Gen had a surprisingly high multiple for 2017 and it has persisted, with an average multiple of 3.53x in 2021. As more competition comes online it has been harder to generate leads for businesses and thus the higher demand for leads.
Service – Again, a consistent performer and easy to understand business. The main value in a service-based business is the book of clients which can be transferred easily and, if they stay on as clients, it can lead to a decent return for a buyer. This category has seen a steady increase in the average multiple from 2017 (2.57x) to around 3.5x in 2021.
Software – Still a very highly-demanded business model and is normally the biggest winner in terms of average multiple of earnings. In 2021, it was only upstaged by an incredible year for Ecommerce businesses, which saw an influx of larger listings. Software averaged 3.63x multiple in 2021 listings, with the highest multiple at 5x.
Are Smaller Or Larger Businesses Worth More?
We can see from the last 14+ years that there are consistent trends of multiples at each price point. The larger your business, the higher multiple you can demand. For example, in 2019 the average multiple for a business that sold between the price of 0 – $250K was 2.05x. However, if your business was worth over $7M, the average multiple was 4.21x. This is why if there is capacity in both the operator and the business for more growth, and the operator can be patient, we recommend growing the business to a higher level before seeking a buyer.
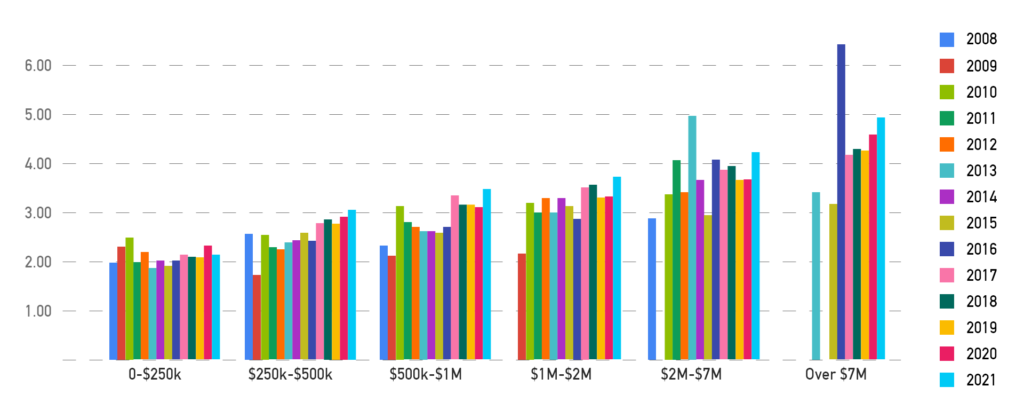
How to interpret this graph: If your business is generating:
- 0-$125K annual profit = valuation range of 0-$250K
- $125K-$200K annual profit = valuation range of $250K-$500K
- $200K-$380K annual profit = valuation range of $500K-$1M
- $380K-$650K annual profit = valuation range of $1M-$2M
- $650K-$2M annual profit = valuation range of $2M-$7M
- $2M-$10M annual profit = valuation range of $7M-$100M
This will give you a pretty accurate range of where you business sits in the valuation spectrum.
How many transactions occurred at each price point?
This graph represents the total number of transactions that occurred in each price range. For example, in 2017, there were 125 transactions in the $0–$250K range. Similarly, there were 103 transactions in the $250K–$500K range.
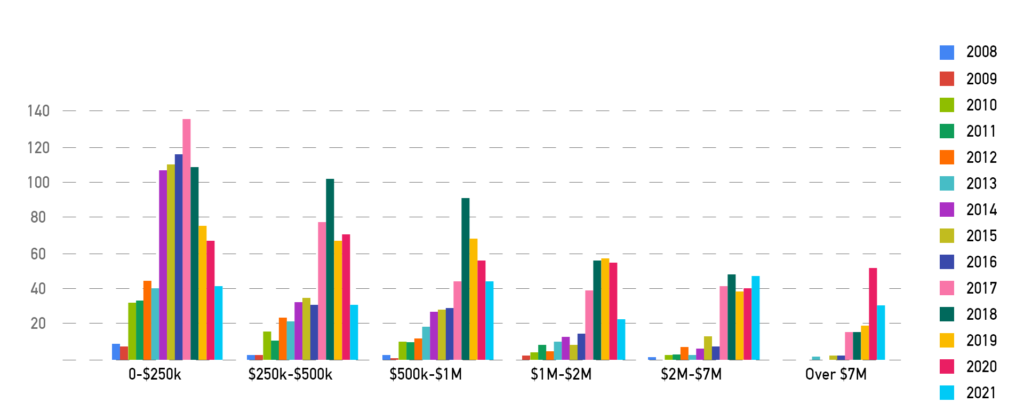
This data represents the volume of transactions at each price point. Obviously, there will be more transactions of “smaller” businesses in the $0 – $500K range and less supply of businesses at a higher valuation range.
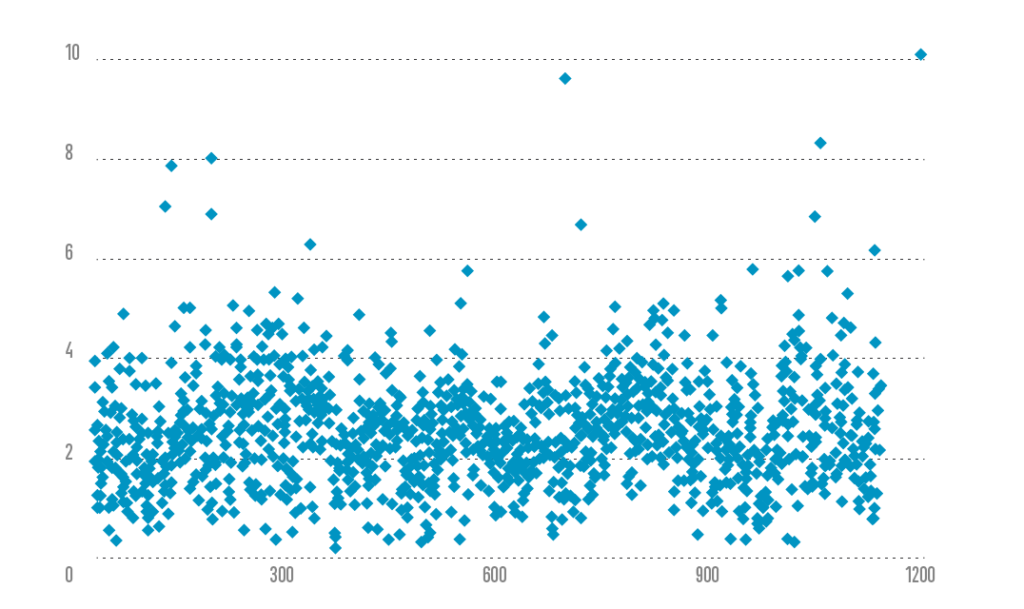
What do the multiples look like on a scatter graph?
To get a true appreciation of averages you need to look at the dataset as a whole. This scatter graph represents each transaction’s multiple:
