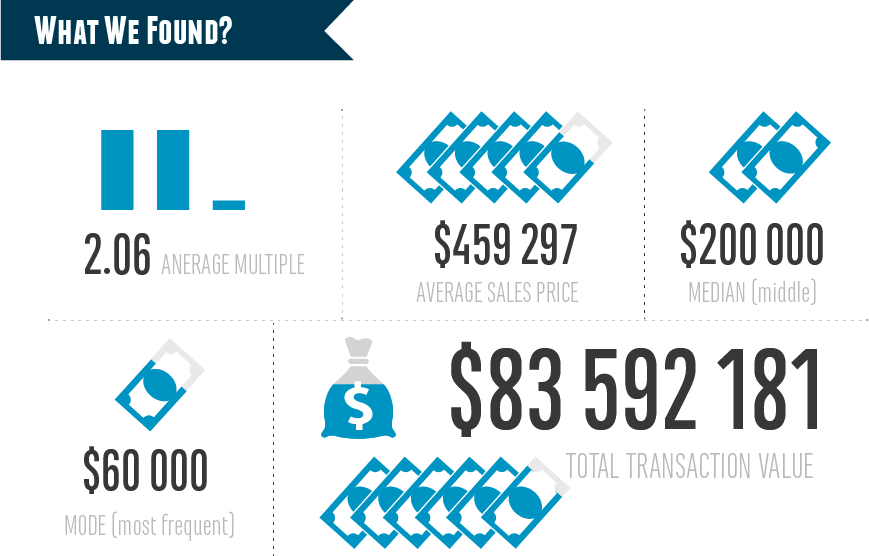
Digital Exits publishes a yearly online business valuation report that analyses the previous years sales data from BizBuySell.com the leading business for sales classified website. In this data we analyse both for sale by owner and for sale by broker online businesses sold in the 2014 period.
The goal with this report is to give tangible data to both buyers and sellers on the valuation multiples of online businesses.
You can see all past reports here:
Some interesting observations for 2014:
- Total sales transacted increased $30 million from 2013 data.
- The total transactions volume double from 2013 to 2014
- Ecommerce business transaction volume double
- Software business transaction volume tripled
- The average multiple decrease dramatically from 2.7 X to 2.06X
We Analyzed 182 Businesses From 6 Business Models
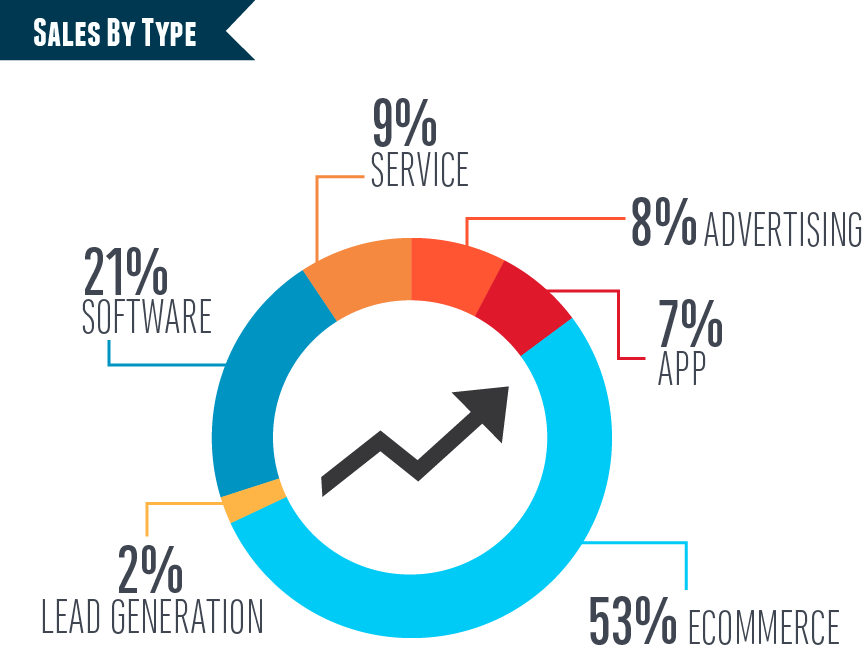
In total we analysed 182 businesses that were sold between January and December 2014. A few assumptions were made. We only analyzed businesses with a sale price higher than $50,000 and removed any obvious outliers in the data set (for example: a business that sold for $80,000 that was making $7,000 in profit for the last 12 months). We have adopted the following definition for each business model:
- Advertising – a website monetized through ads or affiliate offers
- App – a mobile app, monetized through paid downloads, membership or advertising
- Ecommerce – traditional ecommerce stores, drop-shipping and digital products
- Lead Generation – websites monetized through selling leads
- Service – websites monetized through providing a service
- Software – SAAS (software as a service) and any other application based business
What We Found From Our Analysis
What’s Is The Average Multiple Per Business Model?
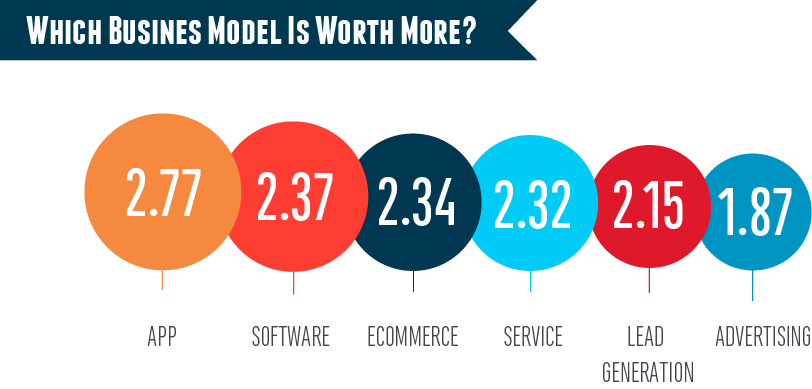
We analysed a multiple of net earnings (yearly profit) to compare business models. For example if an ecommerce sold for $520k at a multiple of 2.6X, then the yearly profit was $200k. 2014 multiples were significantly lower than 2013.
- Advertising -In 2013 the average multiple was (2.15) compared to 2014 of (1.87)
- App – In 2013 the average multiple was (3.85) compared to 2014 of (1.87)
- Ecommerce -In 2013 the average multiple was (2.77) compared to 2014 of (2.34)
- Lead Generation -In 2013 the average multiple was (2.0) compared to 2014 of (2.15)
- Service -In 2013 the average multiple was (2.72) compared to 2014 of (2.32)
- Software -In 2013 the average multiple was (2.56) compared to 2014 of (2.37)
Multiple Range For Business Size
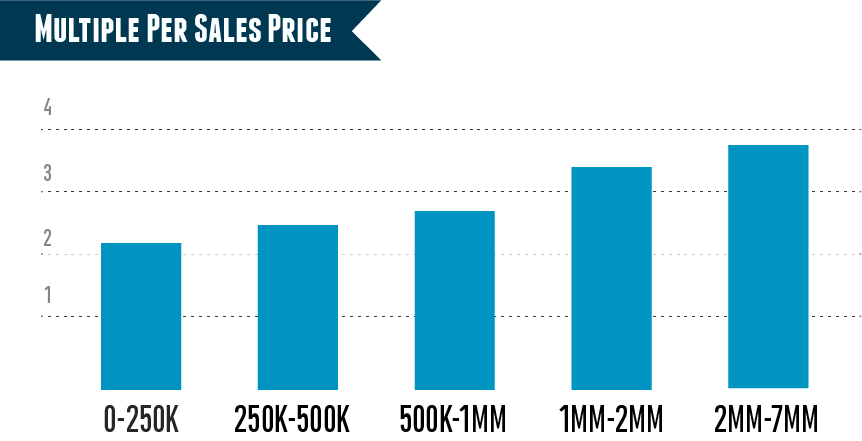
At What Valuation Did Transaction Occur
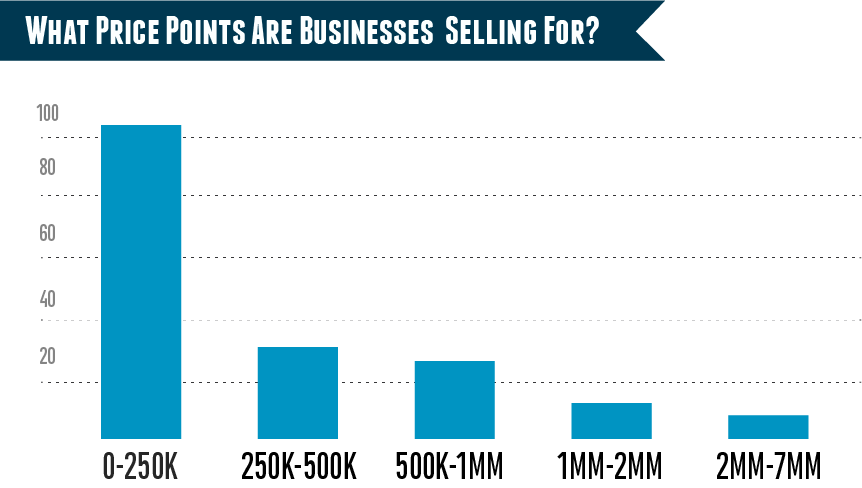
There was a large amount of transactions that took place in the sub $250,000 valuation range. Specifically a lot of transactions occurred in the $50,000 to $150,000 range:
Some interesting facts:
- There was more than double the amount of ecommerce transactions (41 in 2013 compared to 96 in 2014)
- There was triple the amount of software transactions (11 in 2013 compared to 38 in 2014)
What Questions Do You Have ?
I hope you got some value from my analysis of what your online business is worth. But I want to hear about how you plan on using this data when selling your business or any questions you have. Don’t be shy: drop a comment below right now and share the love!
